The US payments industry is huge. American consumers spent a total of $15.7tn in 2021, according to the Bureau of Economic Analysis (BEA).
The payments landscape is also varied and complex. The US may be home to tech giants such as Apple, Google and PayPal, which dominate digital payments worldwide, but it's also a market where cash, cheques and chip-and-signature cards are much more common than in other advanced economies.
Even so, the pandemic has spurred millions of Americans to embrace new payment methods. Contactless card usage is increasing alongside digital wallets and P2P payments.
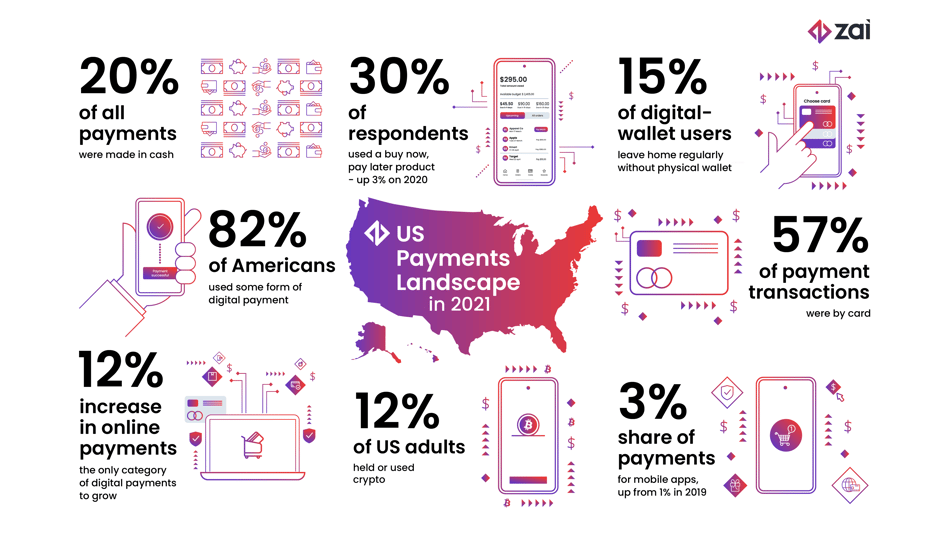
More than 80% of Americans say they used some form of digital payment in 2021 as online payments increased by 12 percentage points, according to McKinsey.
The pandemic has also accelerated the use of e-commerce, which was first captured in a notable shift from in-person card transactions to remote transactions in 2020, when the number of remote payments increased by $8.7bn. That was the biggest one-year increase on record and was also the first time that remote card payments exceeded the value of in-person payments.
Contactless payments and buy now, pay later (BNPL) usage rises
Contactless card payments totalled $110bn in 2020. While this represents a big increase, it's still just 3.4% of in-person card payments. Digital wallets such as Apple Pay are also growing fast from a low base. By 2020, digital wallet payments represented 2.6% by volume and 1.47% by value of all credit and debit card payments.
However, this is still far behind other markets. For example, 25% of all payments in the UK were made using contactless payment methods in 2020.
Even so, the growing acceptance of contactless payments is quickly changing consumer behavior. Among those who use digital wallets, 15% told McKinsey in 2021 that they regularly leave home without their physical wallet.
New forms of consumer credit are also growing in popularity in the US. A 2021 survey of economic well-being by the US Federal Reserve included BNPL services for the first time, revealing that more than 10% of people had used a BNPL service in the past year. Convenience, reluctance to use a credit card and affordability were the main reasons people cited for using BNPL.
The Fed survey also included cryptocurrency for the first time in 2021 and found that 12% of US adults held or used a cryptocurrency in the past year.
About US payments data
Payments industry data in the US is captured in a variety of ways by several different agencies, including Federal Reserve surveys of both consumers and financial institutions, and personal consumption expenditure by the BEA.
While the BEA data is intended to reflect consumer spending only, there is a significant amount of business-to-business spending that is also captured. The data also excludes payments for mortgages, child support and alimony, which are not counted as consumer spending.
Cards
Payments using credit, debit and prepaid cards (as well as electronic benefits transfers) made up 72.7% of all consumer spending in 2020, or $7.8tn, according to Nilson analysis of the BEA data.
When surveyed directly, consumers said they used cards for 57% of payment transactions in 2021, according to the Fed’s Consumer Payment Choice Diary. This was up from 55% in 2020, though the Fed notes that the increase was driven by a decline in the number of cash transactions rather than an increase in card use.
The Fed also surveys depositary and financial institutions about non-cash payments, comparing payments using cards, automated clearing house and cheques. The latest results show that cards were used in 74.25% of transactions in 2020. This was slightly less than in 2019 but was notable because it was the first decline in card share since the survey was first conducted in 2000 — a result of fewer in-person payments due to the pandemic.
Automated clearing house
The automated clearing house (ACH) system provides electronic funds transfers in the US, commonly known as direct deposit, direct pay, or electronic cheque. Payments through the ACH system totalled $1.5tn or 13.5% of consumer spending volume in 2020.
ACH dominates the overall payments system in value terms, making up more than two-thirds of all non-cash payments. This is driven by large-value transactions such as corporate transfers, salaries, loan repayments and bills.
The share of transactions using ACH is increasing both in value and number. The number of ACH transfers rose by 0.84 percentage points to 19.24% in 2020, compared to almost no change between 2015 and 2019.
This is partly due to the use of ACH as a settlement vehicle for smartphone payment apps. This is reflected in the Fed’s consumer survey, which shows that mobile payment apps increased their share of payments from 1% in 2019 to 3% in 2021.
Cash
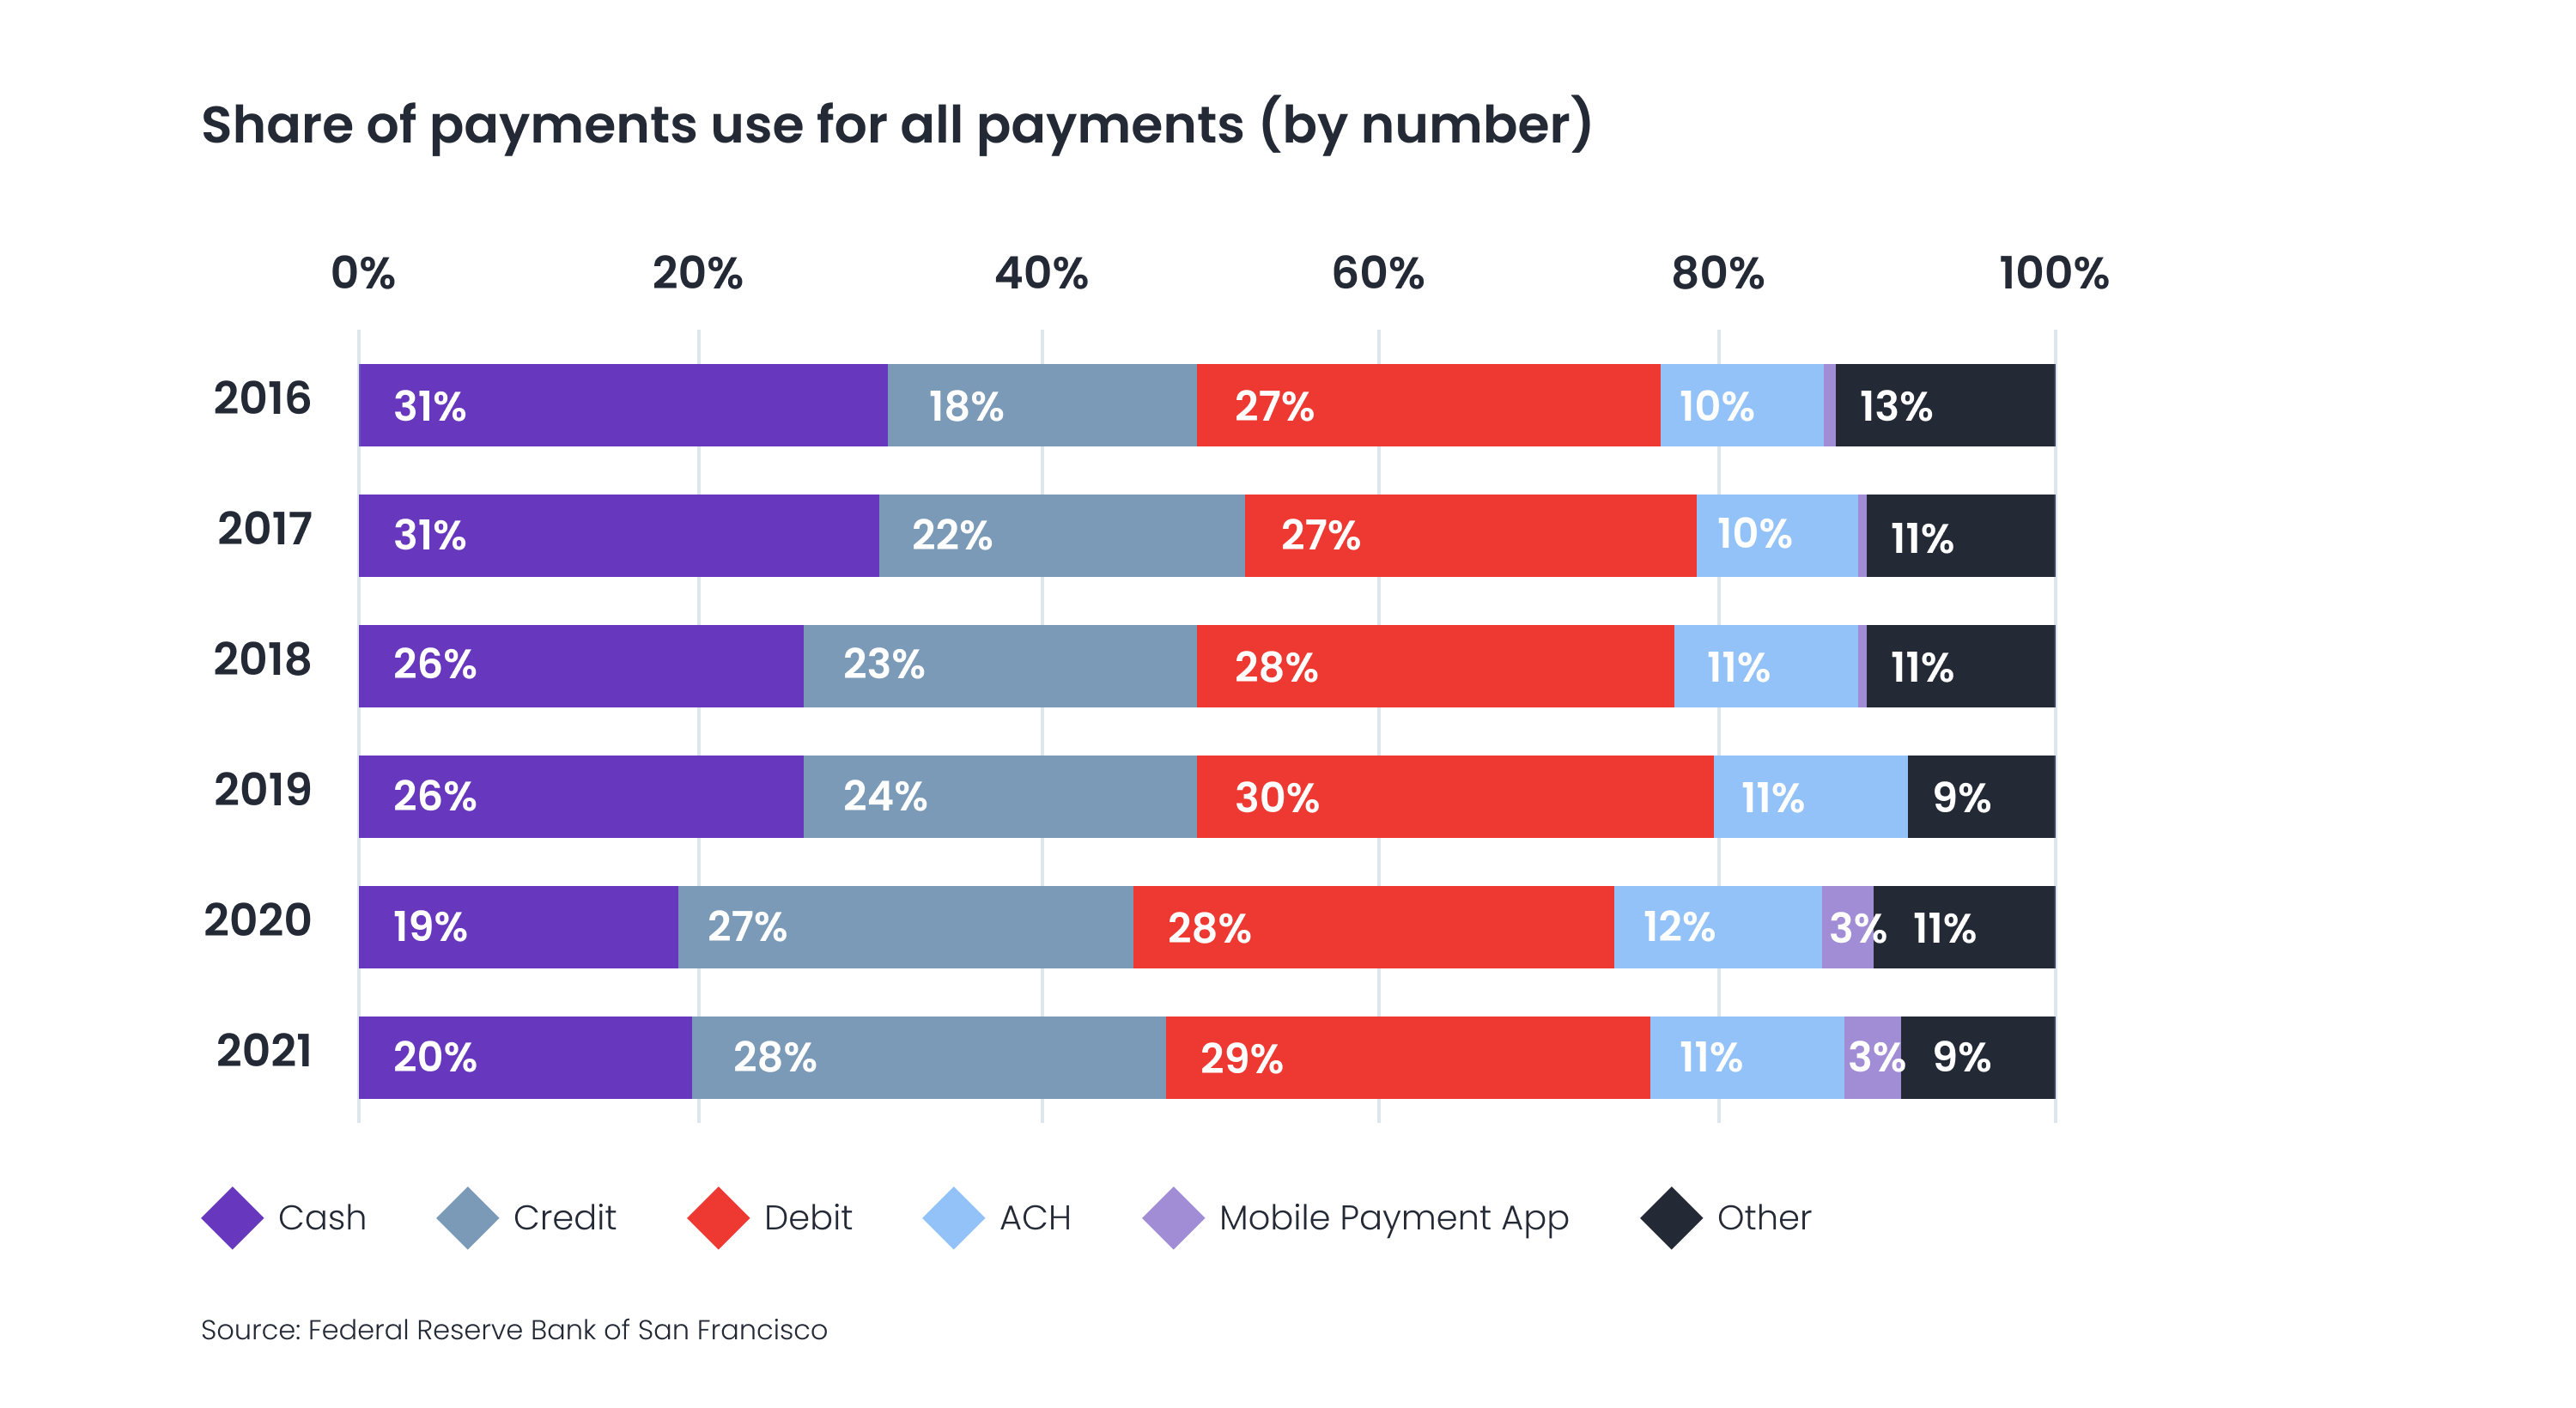
Cash payments rebounded slightly in 2021 after a slump in in-person payments during the height of the pandemic. Data from the Fed’s Consumer Payment Choice Diary shows that cash payments made up 20% of all payments in 2021, up from 19% in 2020.
The fall in the use of cash predates the pandemic, with its share of payments dropping from 31% in 2016 to 26% in 2019.
However, cash is far from dead. Fed data on the volume of currency in circulation shows a sharp 12% jump in 2020 — the biggest increase in the past 20 years.
Official explanations for this surprising preference for cash are lacking. It isn’t reflected in payments data, which suggests that people are either using it for illicit payments or simply holding on to it.
The latest Fed data on ATM cash withdrawals does not include the pandemic period but also shows a long-term increase in the use of cash. The value of domestic ATM withdrawals increased from $310bn in 2003 to $580bn in 2018, which is more than double the rate of inflation.
Useful tips on making platforms and marketplaces work in a more efficient way

.png?width=211&name=Cover%20(6).png)
Cheques
The share of cheques as a form of payment continues to fall. By value, their share dropped by 2.8 percentage points to 22.9% in 2020 with the onset of the pandemic. The number of cheques being written also declined — by a small amount overall, but significantly for commercial cheques, which were down 14.2%.
The BEA’s consumer spending data includes cheques alongside cash and money orders under paper-based payment methods. Together, these payment methods totalled $1.5tn or 13. 8% of all consumer payments in 2020.
Fraud
Card fraud is a major problem in the US. In 2020, fraudulent card use totalled $10.2bn and accounted for 35.8% of the global total, according to Nilson. The rate of fraud was 10.89 cents per $100, compared to a rate of 5.63 cents outside the US.
The high fraud rate in the US is due to weaker security protocols and the wide use of card-not-present (CNP) transactions, which increased significantly in 2020 after the pandemic led to much more e-commerce activity. Around three-quarters of card fraud is attributed to CNP.
One positive effect of the pandemic was a reduction in fraud linked to counterfeit cards, which was associated with the fall in cross-border travel. The lack of advanced security features on some US cards makes them vulnerable to criminals in other countries.
For more information on the payment service offered by Zai, contact a representative here.
How APIs can help companies be more agile